Now that we have installed Zabbix Server, we must install the Graphical User Interface aka the Web interface.
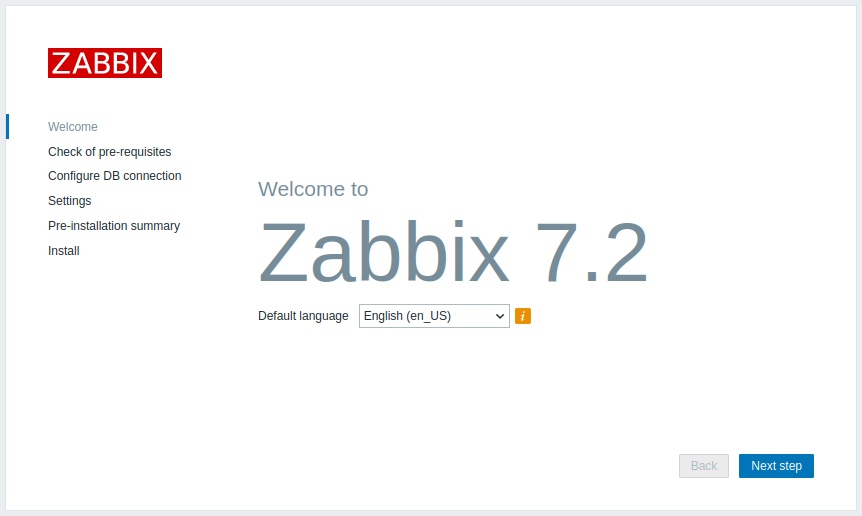
First we must go to to the url so open your browser and go to the website either by the name you set in server_name. e.g. http://zabbix_server/ you will be met with this site.

When you press “Next Step” you will be met with and requirements check.
if all checks OK, just click “Next Step”.
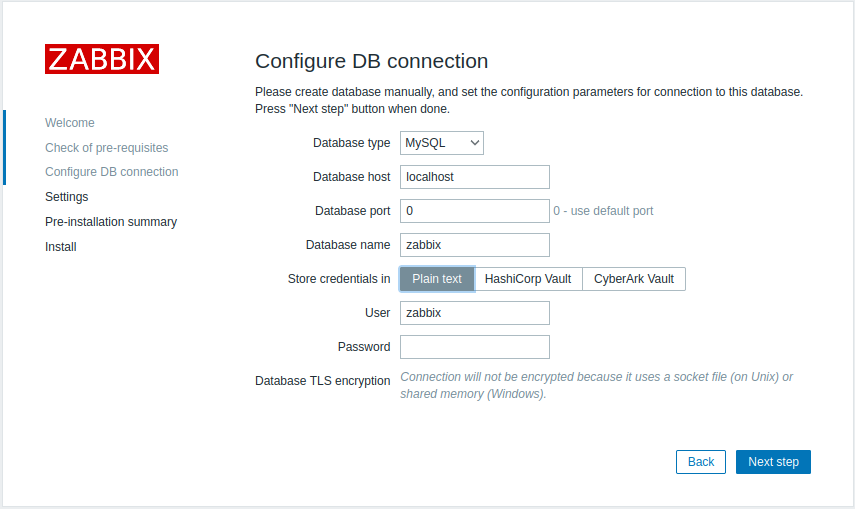
Next up you will need to remember what you wrote as the MySQL password, in the creation of the Zabbix database user.
So the fields that are present must be filled.
As a standard the usual settings are.
Database Type: Mysql
Database Host: localhost ( if the database it setup on the same host as the webserver )
Database port: 0 or 3306 (3306 is the standard MySQL port)|
Database Name: zabbix
Store Credentials: plain text ( if you need info on other options Go to Zabbix )
Database User: zabbix
Database Password: empty

just fill out the fields and you will get another screen where you need to name your Servername (usually Zabbix Server is the name people choose unless they have a naming standard or if you want to set up a Zabbix cluster then you could call it Zabbix Server Alpha/Beta/Charlie ) and set your Time Zone i.e. Europe/Copenhagen if you are in Denmark.
After this is filled out you can click the “Next Step” and you will get a summary of the settings.
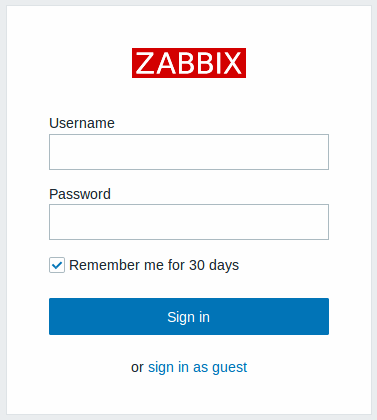
If everything is done correct you should be able to click on “Finish” and be redirected to the Login screen.

Here you can fill in
Username: Admin
Password: zabbix
And boom you have a basic Zabbix setup, and when you login you will infact have one host you are monitoring, your Zabbix Server it self.
now you have the possibility to create monitoring on almost anything you can imagine.
To mention things i have monitored.
- Webservers on linux servers
- Video Feed Stream for commercial
- Viewers of live TV on streaming platform
- Website response time
- If VPN was up
- Phillips Hue Lights/sensors etc.
The possibilities are endless, if you can get data out from it or contact it you can monitor it in zabbix.
It will probably post things / examples of how to monitor stuff in future posts
and i will also go deeper into creating maybe some more complex Zabbix setups, such as HA cluster, Zabbix Via Docker, Zabbix monitoring docker.
and may even a simplified version where you can get Zabbix to create ServiceNow incidents. Stay tuned!!!!